FII & DII Data
Institutional Money Matrix | by Mr. Chartist
LOADING…
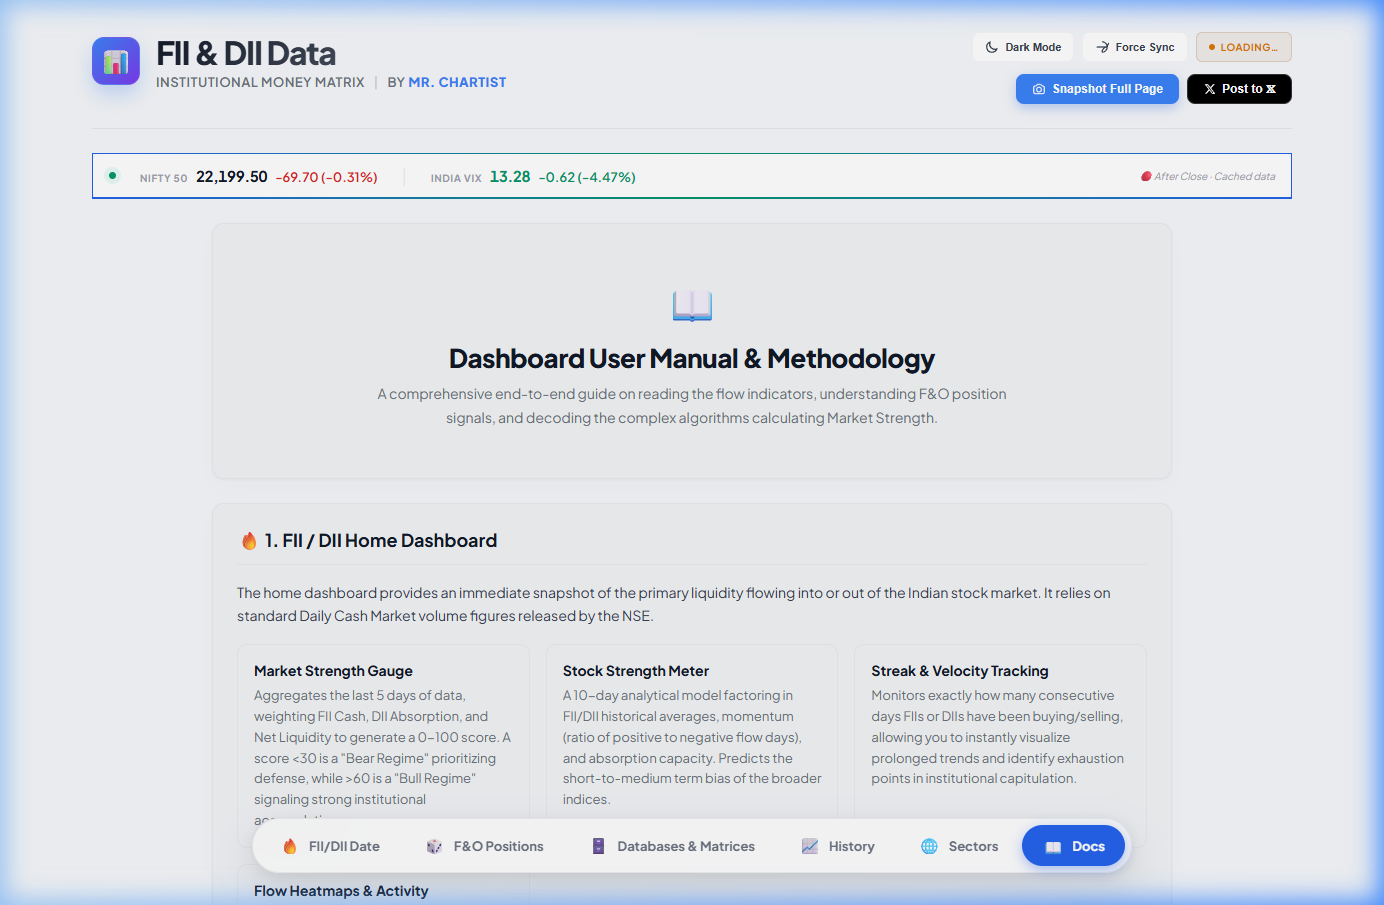
Nifty 50
--
India VIX
--
Loading
Fetching market data…
🔔 Alert Settings
Choose which data feeds you want push notifications for
Institutional Cash Flows
Daily FII/DII net buy/sell & combined liquidity drain
Mon–Fri · ~6:30 PM IST
F&O Sentiment Matrix
Daily derivatives positioning, PCR & sentiment score
Mon–Fri · ~6:30 PM IST
Sector Rotation Index
Fortnightly NSDL FPI sector-wise allocation updates
Fortnightly · ~10:00 AM IST
INSTITUTIONAL FLOW TERMINAL
Command Center
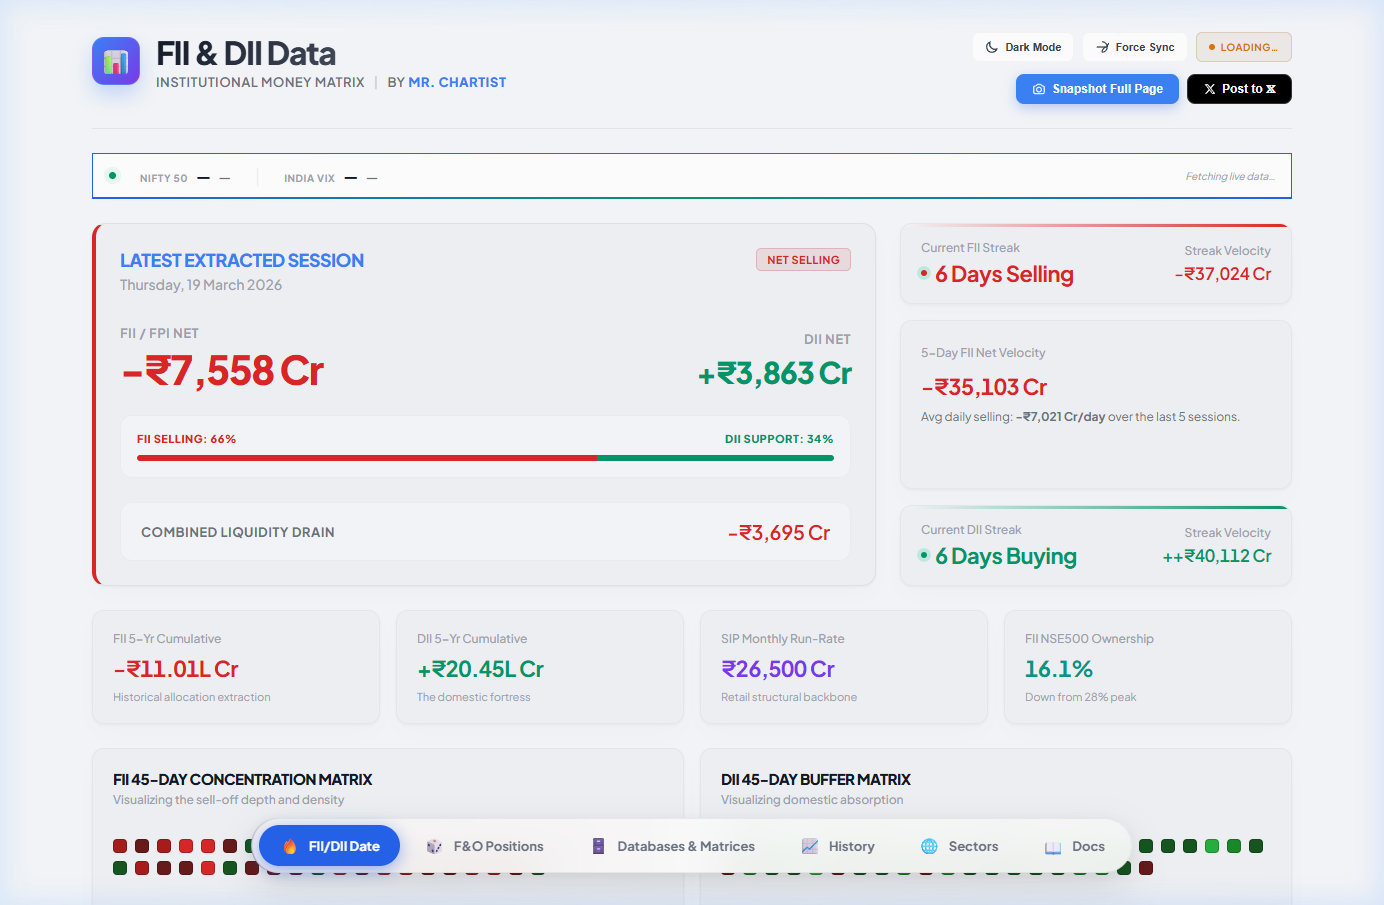
Session
Latest session loading
Market State
Awaiting data
Refresh
Live monitor
Cash Flow Tape
Loading latest sessionPROVISIONAL
Syncing
FII / FPI Net
--
DII Net
--
Combined Liquidity
--
FII Pressure: --
DII Support: --
Signal Replay — last 30 sessions
🟩 Both buy🟧 Absorption🟦 FII only🟥 Both sell
Signal Stack
Flow, equity, derivatives, agent bias
Market Strength
--
Loading
Stock Strength
--
Loading
F&O Sentiment
--
Loading
AI Regime
--
Optional
Momentum Stack
Streaks, velocity, anomaly counts
FII Streak
--
--
DII Streak
--
--
5D FII Velocity
--
Computing
Bloodbath / Absorb
--
Divergence --
F&O Snapshot
Latest derivatives positioning
BiasLoading
Call / Put Net--
Futures Net--
Sector Rotation
NSDL fortnight leaders
Top InflowLoading--
Top OutflowLoading--
AUM LeaderLoading--
1Y LeaderLoading--
45-Day Flow Matrix
3D institutional cash pressure visualization
Buy
Sell
Flat
FII / FPI FLOWS
DII FLOWS
Recent Sessions
Last 12 institutional flow records
| Date | FII Net | DII Net | Net Liq | Signal |
|---|---|---|---|---|
| Loading recent sessions... | ||||
Total Sessions
—
in daily archive
Avg FII Daily Net
—
across all sessions
Avg DII Daily Net
—
across all sessions
FII Bloodbath Days
—
sessions < -₹5k Cr
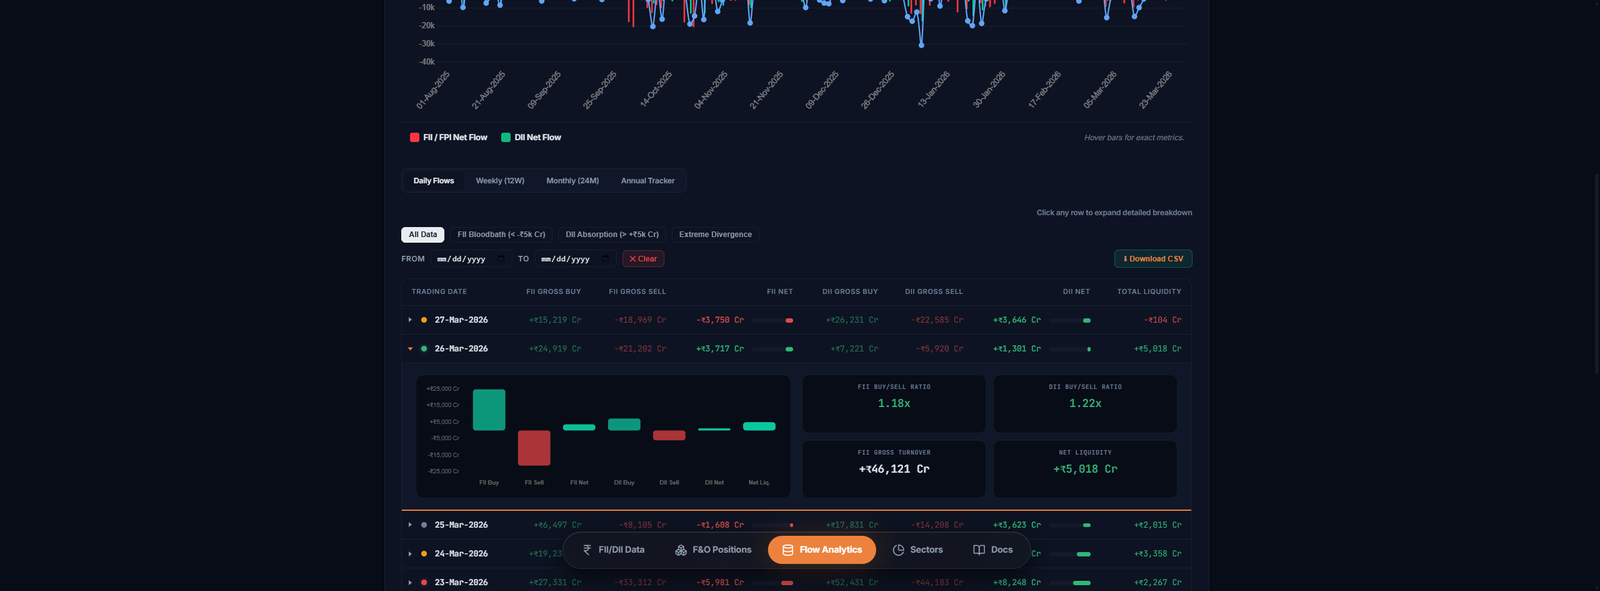
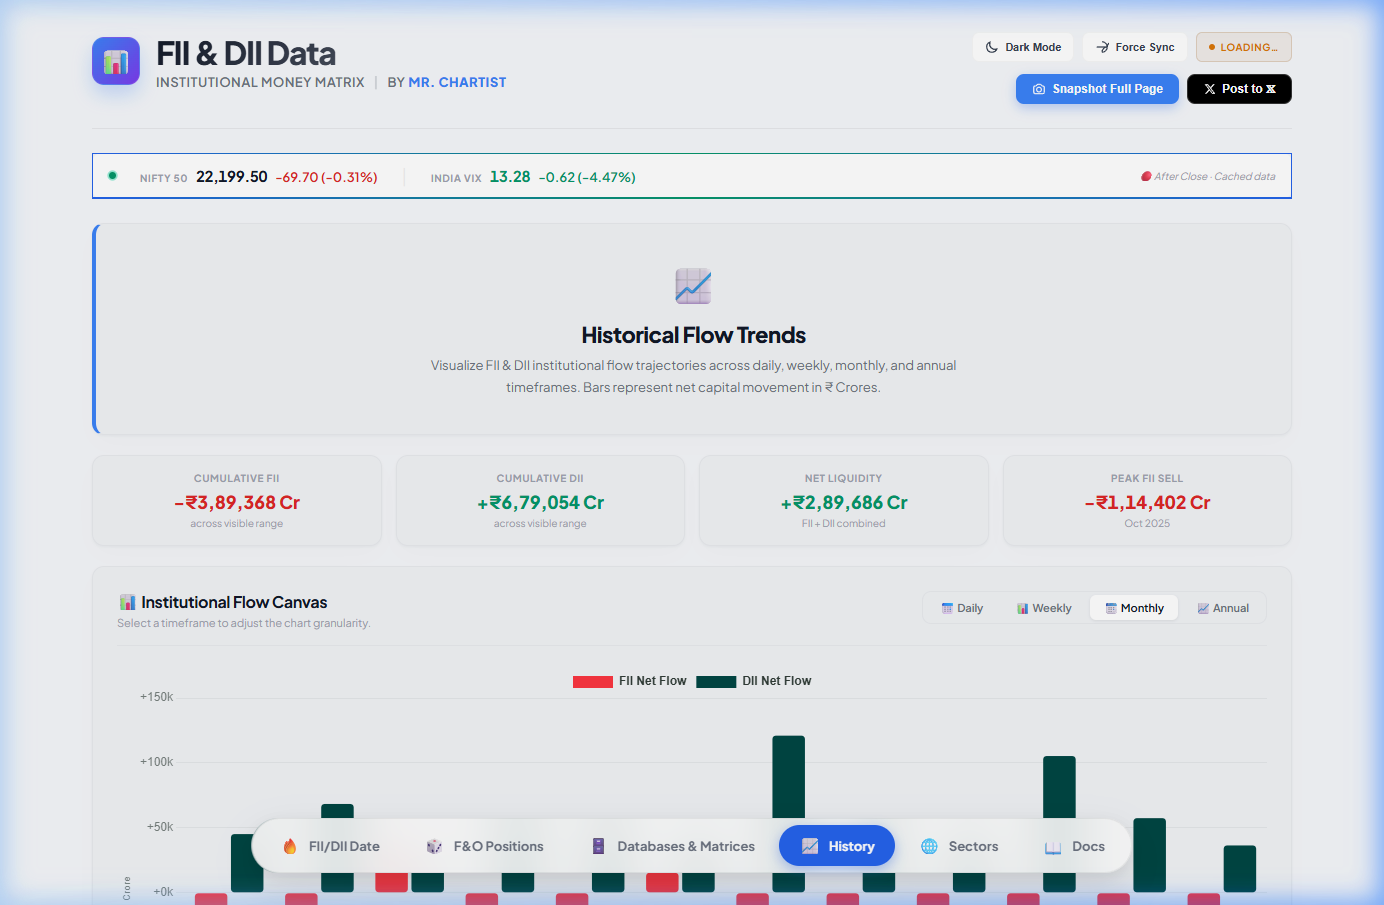
FII / FPI Net Flow
DII Net Flow
Hover bars for exact metrics.
Daily Flows
Weekly (12W)
Monthly (24M)
Annual Tracker
Click any row to expand detailed breakdown
| Trading Date | FII Gross Buy | FII Gross Sell | FII Net | DII Gross Buy | DII Gross Sell | DII Net | Total Liquidity |
|---|
Showing 0 - 0 of 0 rows
| Week Ending | FII Net | DII Net | Combined Liquidity | Weekly Trend Signal |
|---|
| Month & Year | FII Net | DII Net | Net Money Printer | Nifty Market Chg |
|---|
| Calendar Year | FII Equities Net | DII Equities Net | Total Institutional Flow | Domestic Multiplier |
|---|
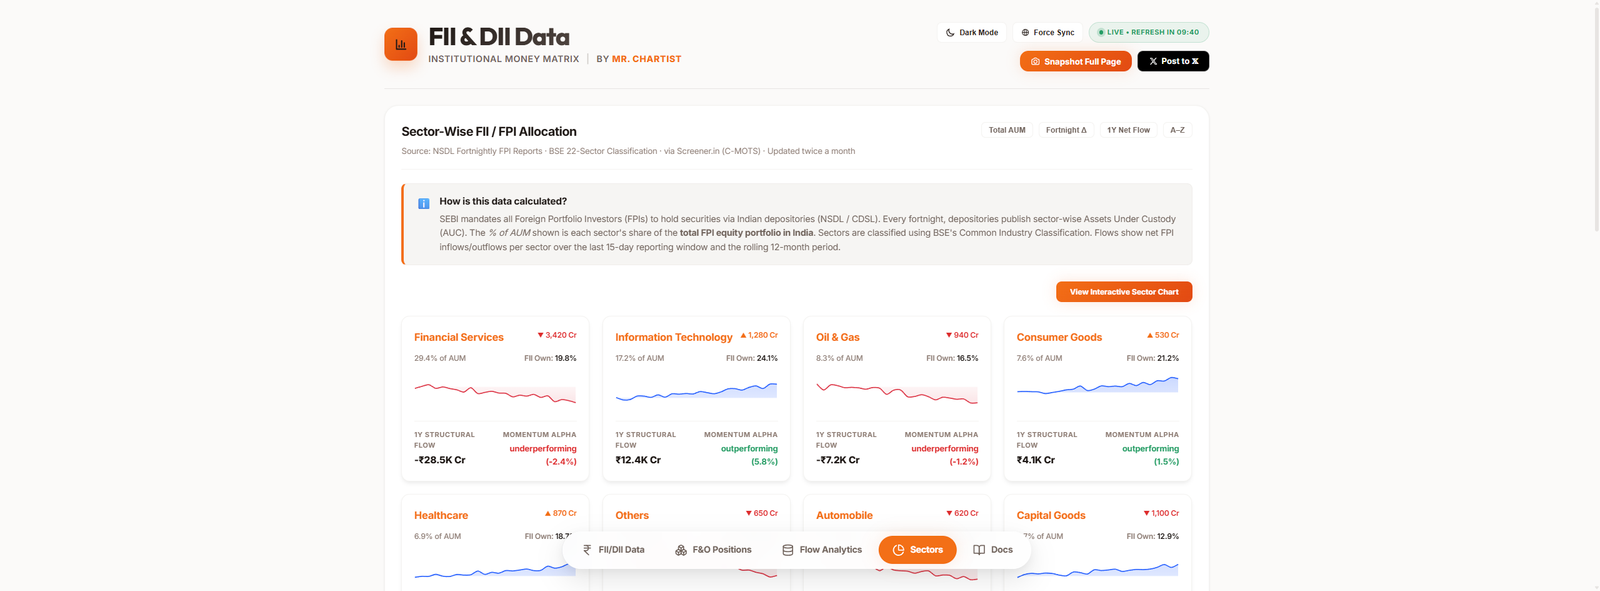
Sector-Wise FII / FPI Allocation
Source: NSDL Fortnightly FPI Reports · BSE 22-Sector Classification · via Screener.in (C-MOTS) · Updated twice a month
Loading sector data…
Net Inflow (fortnight)
Net Outflow (fortnight)
Data updates every ~15 days. Last update date shown in card header.
Sector Name
Alpha
1Y Structural Flow
--
AUM Weight
--
FII Ownership
--
Fortnight Flow
--
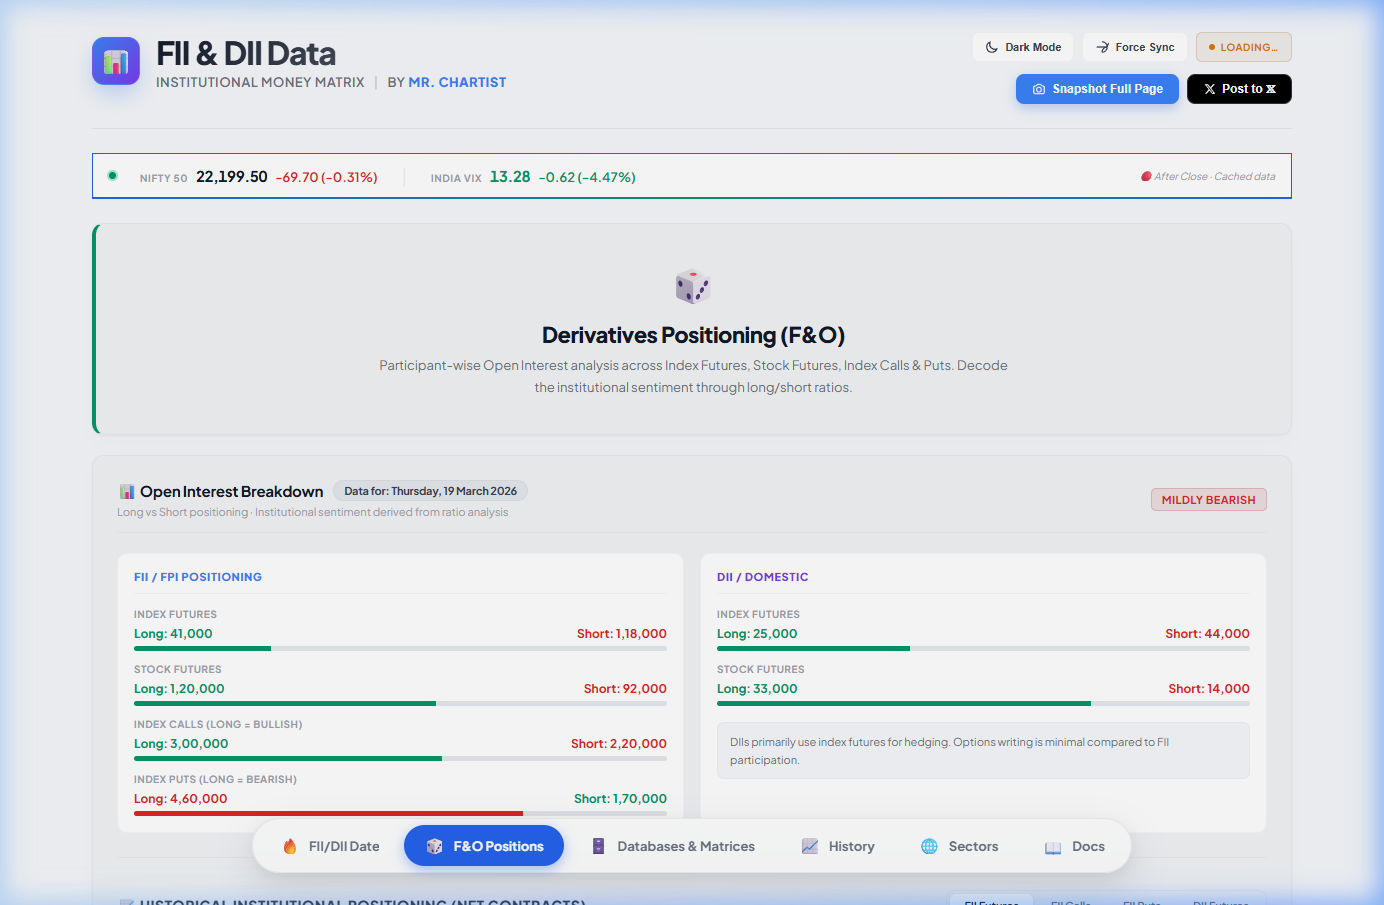
Open Interest Breakdown
Data for: —
Long vs Short positioning · Institutional sentiment derived from ratio analysis
—
FII / FPI Positioning
Index Futures
Long: —
Short: —
Stock Futures
Long: —
Short: —
Index Calls (Long = Bullish)
Long: —
Short: —
Index Puts (Long = Bearish)
Long: —
Short: —
DII / Domestic
Index Futures
Long: —
Short: —
Stock Futures
Long: —
Short: —
DIIs primarily use index futures for hedging. Options writing is minimal compared to FII participation.
📈 Historical Institutional Positioning (Net Contracts)
FII Futures
FII Calls
FII Puts
DII Futures
⚖️ FII Long-Short Ratio (Index Futures)
—
Shaded band = 10th–90th percentile of the loaded history. Readings outside the band are positioning extremes.
Active Artificial Intelligence Nodes
Loading node states...
Active Institutional Regime
—
Waiting for server…